INVESTMENT
PORTFOLIO
HIGHLIGHTS
It was a strong year for Quayside’s Investment Portfolio. Listed equities, as well as real assets, drove returns, and real estate values recovered. We continued to build a more diversified and resilient portfolio for the years ahead.

Global markets had real momentum, especially in sectors tied to artificial intelligence and digital infrastructure. But it wasn’t a smooth ride. Geopolitical shocks, trade tensions and shifting interest rate expectations kept volatility high throughout the year.
Real Assets and Real Estate also turned a corner. Investor confidence improved, interest rates eased, and cap rates (the rate of return expected on a property investment, based on its income) began to firm, lifting values across our well-located, wellleased assets. Real Assets, which is predominantly exposure into the kiwifruit sector, provided strong financial results on the back of another strong kiwifruit season.
Over the year, we continued broadening the base of the investment portfolio, adding global bonds and rebalancing during the year.
As an intergenerational investor, that’s the point: generate strong returns, but build a portfolio that holds up through different market conditions. One that gives us a platform to keep growing.
Private Equity
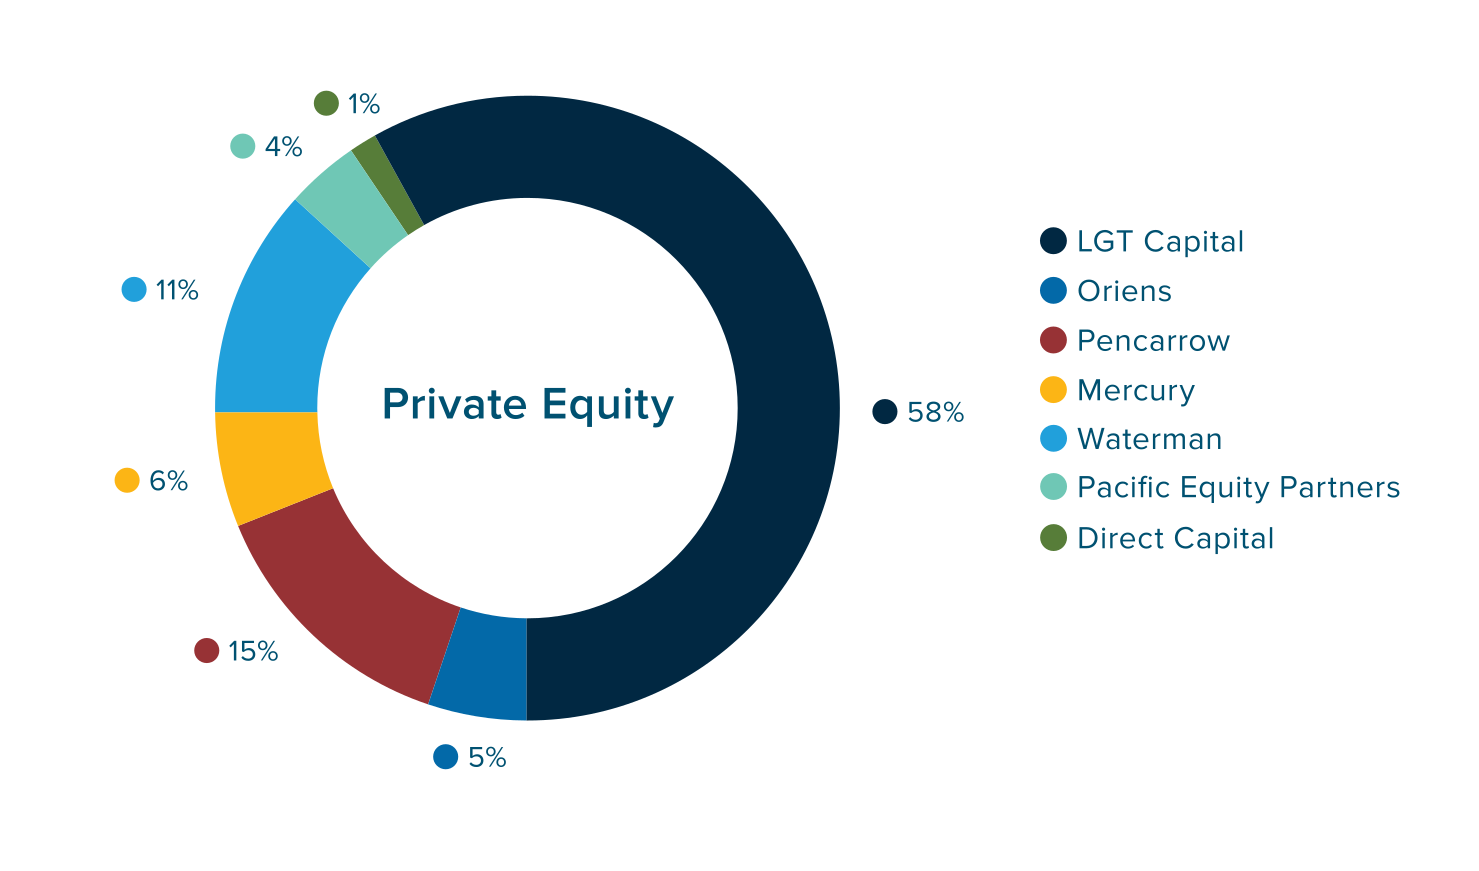
Private equity remains an important component of Quayside’s portfolio. The asset class offers the potential for strong long-term value creation and provides diversification benefits through exposure to specialist managers and businesses whose performance is less reliant on public market movements. As a patient, long-term investor, Quayside believes the benefits of private equity are best realised over extended time horizons.
Quayside’s managed Private Equity portfolio performed moderately over the period, and it was a slower year for realising returns. Whilst activity levels recovered over the period, liquidity pressures persisted, resulting in delayed timing of returns. This dynamic was reflective of market conditions rather than any weakening in the underlying companies, which generally continued to trade well. The focus remains on taking a portfolio approach: partnering with high-quality managers, building a laddered vintage profile (investments made across different years to smooth out exposure to market cycles), and broadening geographic exposure over time. Quayside also continued to refine its Private Equity investment strategy during the year and undertook due diligence on Allegro Funds Ltd, which was added to the portfolio post balance date.
Some key activities that occurred with Quayside’s managers in the year were:
- Waterman Capital, a key NZ-based PE manager for Quayside saw significant M&A activity for it’s portfolio company New Zealand Clinical Research.
- Mercury Capital acquired a significant stake in leading financial services business Forsyth Barr.
- Another portfolio highlight was continued growth from Tend Health, a portfolio company in Pencarrow Private Equity. During the year, Tend committed to acquiring Green Cross Health’s medical division, The Doctors. The transaction is expected to significantly expand Tend’s patient base and strengthen its position in the primary health sector.
- PF Olsen and Forest360 merged during the year, in a transaction supported by Quayside as PF Olsen’s cornerstone investor, alongside Adamantem Capital’s Environmental Opportunities Fund. The merger created Australasia’s largest independent forestry management company.

Listed Assets
Listed equities were a significant contributor to portfolio performance during FY26 supported by strong returns from both global and domestic equities. While investor attention remained focussed on artificial intelligence, semiconductors, data centres and digital infrastructure, the year was also characterised by increasing market concentration with a relatively small number of companies generating a disproportionate share of global equity returns.
At the same time, markets experienced significant volatility. Conflicts in the Middle East, ongoing trade tensions and uncertainty around global growth all affected investor sentiment during the year. Higher risk-free rates also affected bond prices during the period, with tariffs and geopolitical shocks identified as contributing factors.
Against this backdrop, Quayside continued implementing refinements to its listed equities strategy developed during late 2025. The review reflected a shift away from a thematic ETF approach towards a more deliberate portfolio construction framework, aligning capital with areas where earnings growth was most compelling. This included reducing exposure to Australian equities and increasing exposure to global opportunities,
The revised strategy performed strongly during the year. The Global Equities portfolio was a standout contributor, delivering a return of 56.2% for the year compared with 28% for its benchmark.
Performance was led by holdings including Micron, Samsung and Taiwan Semiconductor, all of which benefited from growing demand for advanced semiconductor and data centre infrastructure. The results reflected both favourable market conditions and active investment decisions by the Quayside team.
Domestic equities also contributed positively despite a challenging economic backdrop. Higher interest rates and weaker economic conditions created challenges for households and businesses. However, the portfolio benefited from holdings in companies with resilient business models, strong balance sheets and attractive long-term growth prospects. In particular, Infratil was a significant contributor supported by strong operational performance and continued investment in digital infrastructure.
Fixed income also remained an important part of the portfolio. Higher interest rates provided more attractive income opportunities for fixed income investors than in recent years, while bonds continued to play a role in providing stability, income and diversification. During the year Quayside added global fixed income as a strategy, providing additional resilience and liquidity to the portfolio. This strategy is delivered by external managers to get access to deep global debt and credit markets, also supporting and enhancing the domestic exposure.
| Asset Class | Return | Benchmark Return |
|---|---|---|
| Domestic Equities | 8.7% | 8.8% |
| Global Equities | 56.2% | 28% |
| NZ Fixed Interest | 5.6% | 5.5% |
| Global Fixed Interest | 1.8% | 1.7% |
Property & Real Assets
Quayside’s Property and Real Assets portfolio has endured a challenging market this year. The New Zealand commercial property market gradually recovered during the year, with easing interest rates and improving investor confidence supporting increased transaction activity, particularly for welllocated and well-leased properties.
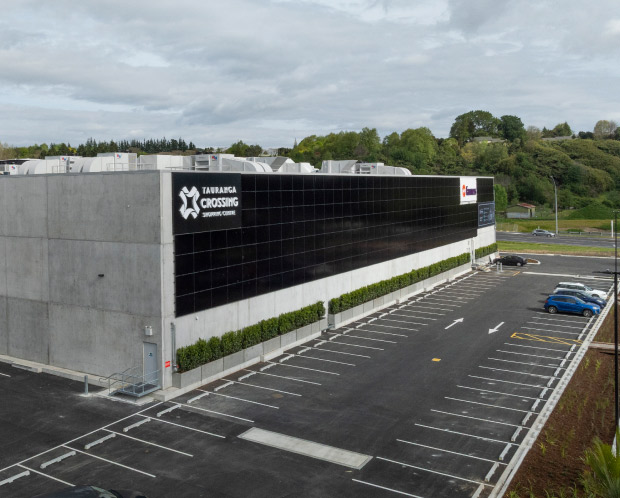
Tauranga Crossing reached a major milestone with the completion of Stage 3. This added Farmers as a second anchor tenant, alongside multiple key tenants. The asset maintained and grew value through its active development programme, reinforcing its role as a strong foundation within Quayside’s portfolio and supporting the growth of one of the Bay of Plenty’s key growth corridors.
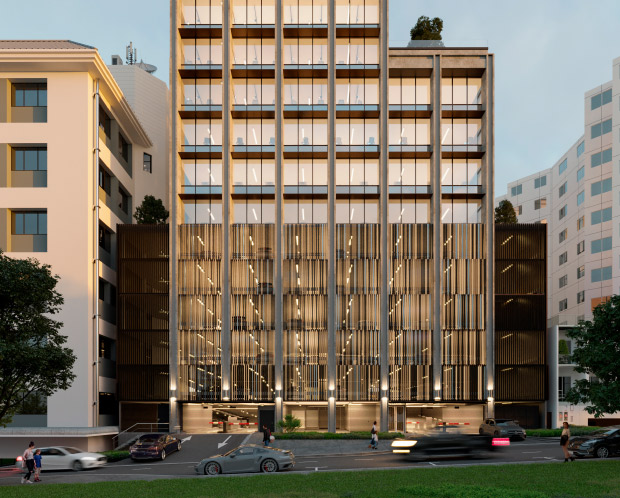
Panorama Towers also delivered value gains over the financial year, supported by further leasing activity. The investment continues to show the benefits of Quayside’s strategic partnership approach and its ability to work with high-quality partners to reposition assets into higher and better use.
Across the balance of the property portfolio, static assets remained steady, with progress continuing under Quayside’s capital balancing and recycling programme. Key activities included the divestment of the Tauriko landholding to NZTA, supporting improved transport outcomes for the Bay of Plenty, and securing a major long-term lease with GEA at Portside Drive, strengthening income security within the portfolio. Quayside also completed the sale of its Fenton Street property in Rotorua, occupied by Council, to Te Arawa Group Holdings, reflecting an ongoing desire for authentic and meaningful relationships with iwi partners.
Huakiwi enjoyed a strong year, supported by another positive kiwifruit season and continued operational improvements across its orchard portfolio. The business is now generating positive annual cashflow, with a cumulative $9.3 million distributed to the joint venture partners since inception, including 50% to Quayside through its ownership interest. Performance was underpinned by solid orchard yields, with SunGold production averaging 18,832 trays per hectare and green orchards returning to profitability following targeted management initiatives.

Key Performance Metrics:
Investment Portfolio Return
0
%
1 year return

0
%
3 year rolling return
0
%
5 year rolling return
Portfolio Valuation
$
0
million
After fees and internal cost allocation.
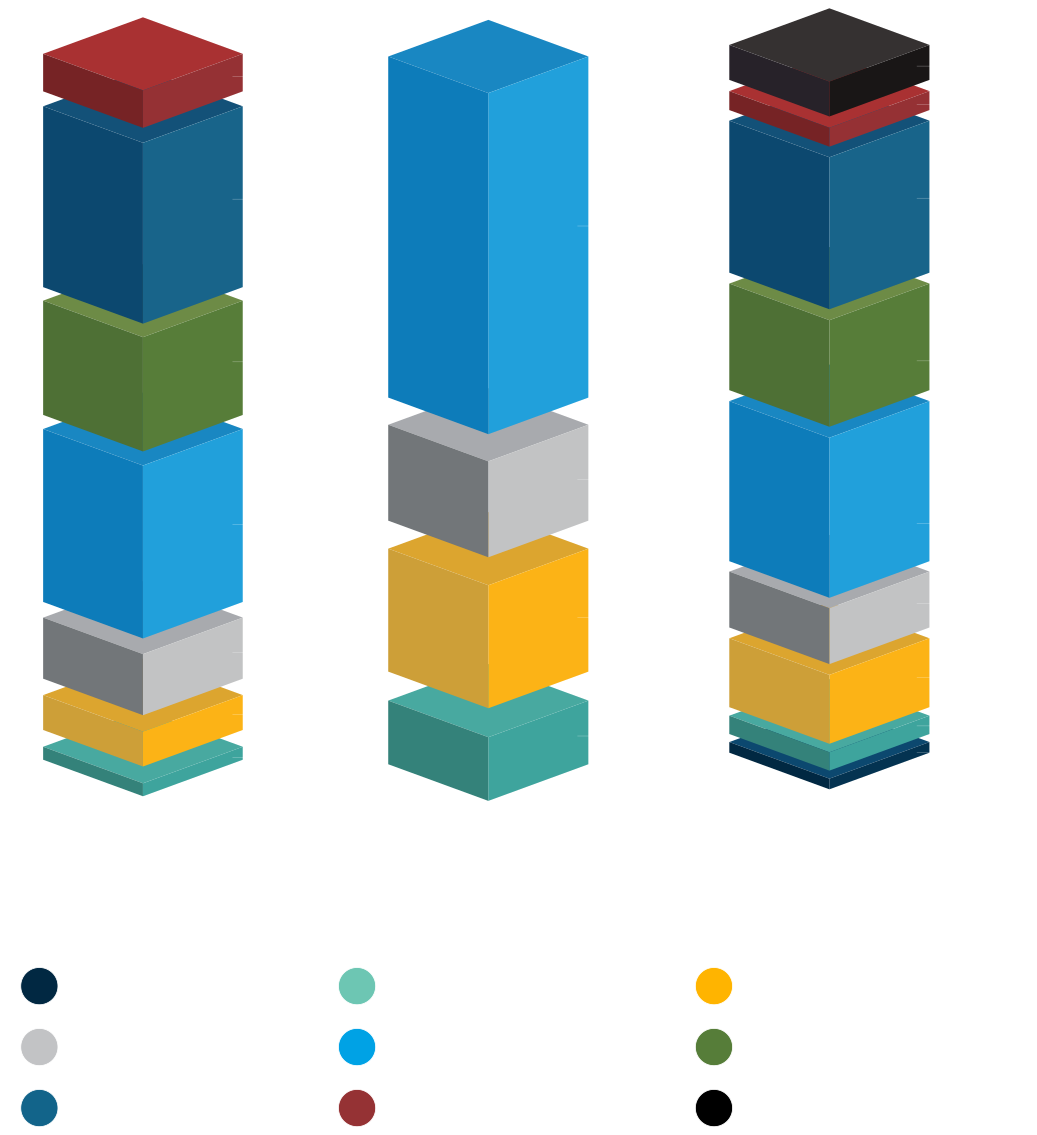
Asset Allocation Comparison
(Net Assets)

UNDERSTANDING THE
TOTAL COST OF INVESTING
For the Bay of Plenty community, the important question is not just what Quayside costs to run, but whether those costs help protect and grow the regional investment fund that supports Council and helps reduce pressure on rates over time.
Two different measures help answer that question. Cost to Serve reflects the direct cost of running Quayside, including people, systems and governance.
However, this does not capture the full cost of managing the Investment Portfolio. Some investment costs are charged within externally managed funds and are deducted before investment returns are reported.
The Total Expense Ratio (TER) combines both Quayside’s direct costs and these embedded investment costs to provide a more complete picture of the total cost of investing. As a result, TER is the more meaningful measure when assessing the efficiency of the Investment Portfolio and comparing costs against long-term investment performance.
For FY26, Quayside’s Investment Portfolio TER was 1.11%. This provides the Bay of Plenty community with greater transparency about the total cost of managing the fund and helps assess whether those costs are delivering value over time.
Cost to Serve
|
0.50%
People, systems, governance and other direct operating costs

Embedded investment costs
|
0.61%
External manager fees and costs deducted within investment returns

Total Expense Ratio
|
1.11%
Total investment cost as a percentage of assets under